Flying Probe Data Analyzer
Project Goal
A lite 2D CAD software developed to visualize and analyze data aquired from the ATG Flying Probe Tester. Furthermore this software has capability to edit IPC files, which are requirements for setting up electrical tests.
Project Details
- Flying Probe Data Analyzer was developed for NASA Goddard Space Flight Center, Detectors branch, Code 553.
- Language used: C#
- Source code is property of NASA GSFC and cannot be shared.
Introduction
ATG flying probe tester is a tool to measure open and short circuits between desired points. This tool can measure thousands of pair in minutes. Therefore, the amount of data acquired by this tool is large for plotting in excel and analyze measurement by measurement.
ATG flying probe tester accepts an .ipc file as input which contains information about probing points defined by user, as well as layers in circuit design. ATG software uses this file to generate job project for the tester, and saves the raw measurement results in a different file.
In order to make data analysis simpler and automated I developed 'Flying Probe Data Analyzer' software, which is able to read .ipc file as well as measurement file, and visualize the results in graphical, tabluated, or graph formats. The data visualization part is has pan and zoom capabilities which is similar to other commercially available 2D CAD software for circuit design. Below I discuss various features of this software.
IPC Reader and Modifier
IPC file holds information regarding test points on the circuit as well as cuircuit design. Test points that are connected to each other through metallic layer are assigned Net numbers, and each test point is called a Pad. So, each Net includes at least 2 Pads. Adjucency list for each Net in IPC file corresponds to Nets that have distances along their paths lower than the threshold set by the user. So, adjucent nets are considered for shorts test (to verify that adjucent Nets are not shorted together).
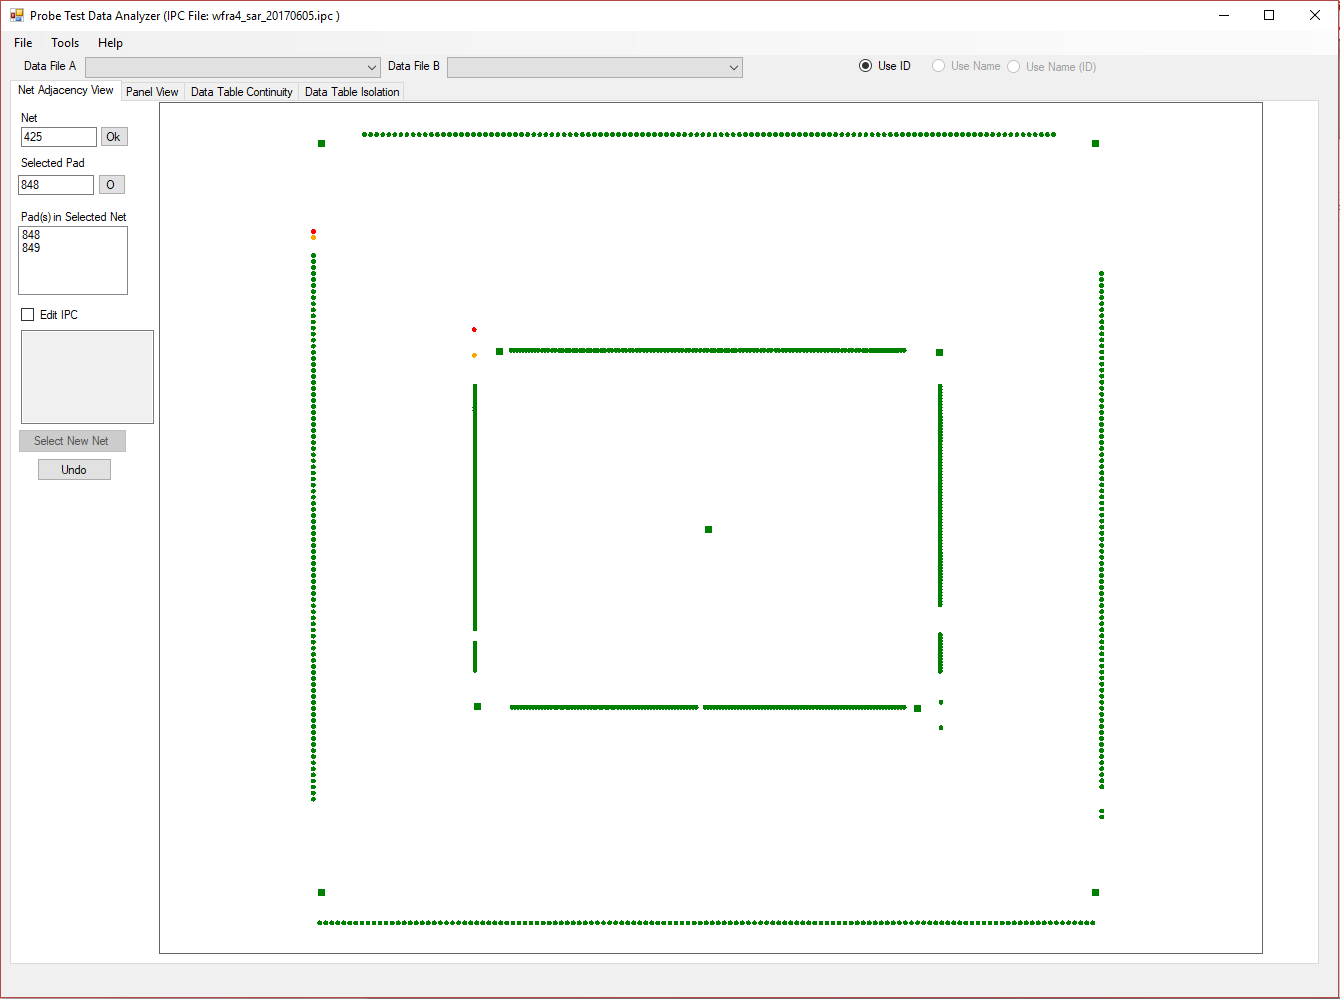
Flying Probe Data Analyzer allows the user to modify this adjucency list if the user believes that automated ajucency list calculators (other commercial software) are not proper for the current task. The software requires the user to first load an IPC file, which reads Pads and Nets from the file, and allows the user to view adjucency list for each Net by clicking on the desired Pad or Net or typing the Pad# or Net#. This is shown in the image below, where the selected Net is colored as red, and ajucent Nets are colored as orange. Using the Edit IPC check mark, a user can modify the adjucency list as s/he sees fit. After editing, user can Save the IPC As a new file, and the software generates the adjucency list based on the changes applied in IPC format, which is readable by other commercial software.
Data Visualization
In order to visualize the data, an IPC file has to be loaded first. This step is mandatory since the measurement files do not have information regarding Nets and Pads, but only coordiantes. So, the software matches the coordiantes with those provided by the IPC files to find the corresponding Pad and Net. For this reason, the software does not allow the user to load the data file before loading the IPC file first.
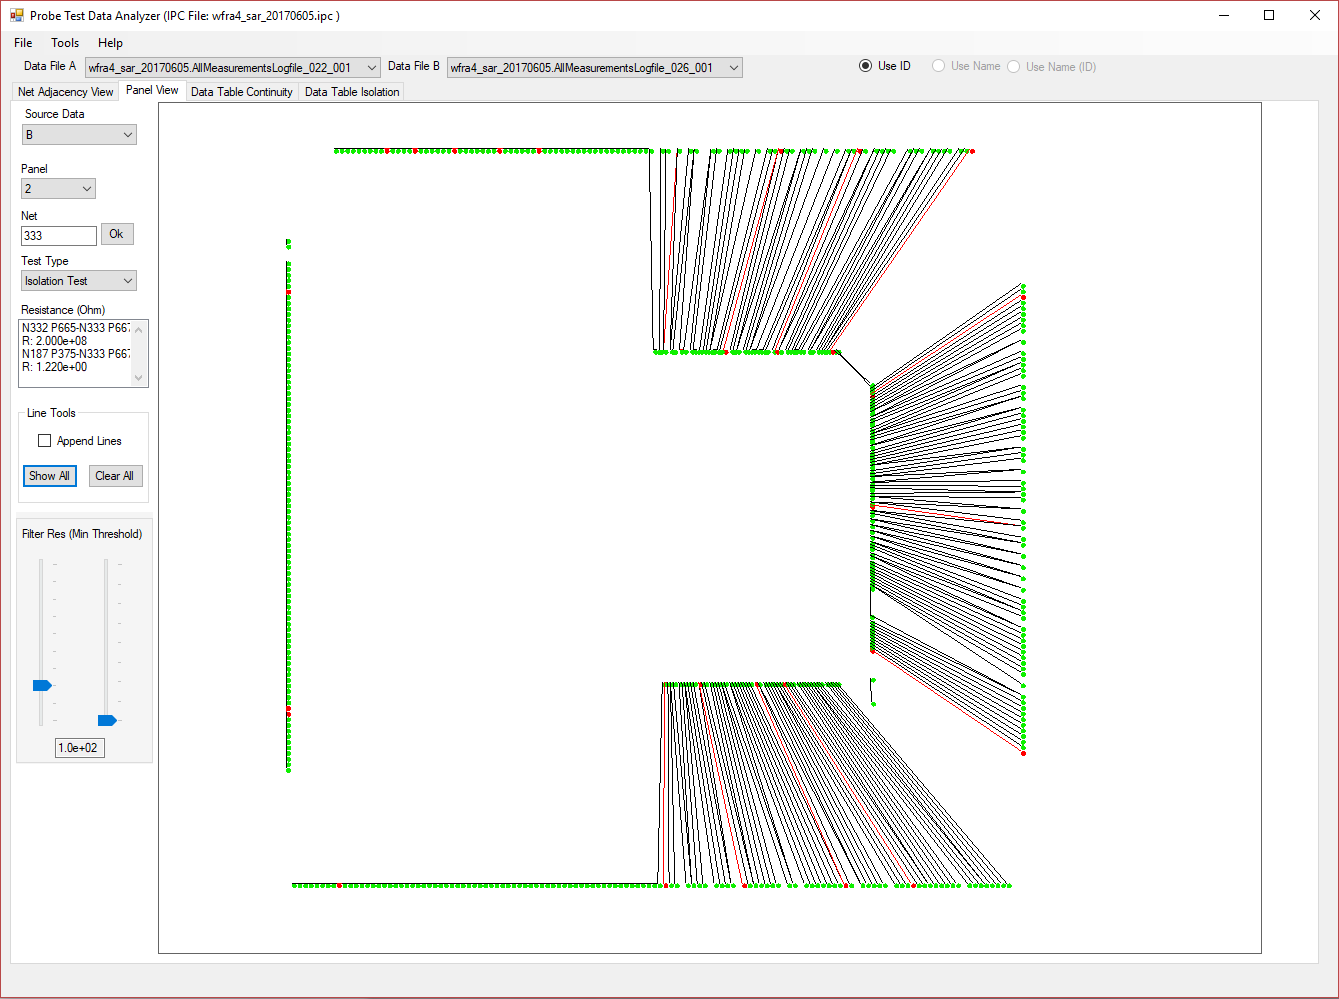
Data visualization can be accessed in 'Panel View' tab after the corresponding data file is loaded. Each data file holds information about opens test (continuity) and shorts test (isolation), selectable from the dropdown combobox. As the same chip design can be repeated on a wafer, a step and repeat is used in ATG flying probe tester, which repreats the same measurement for each chip. These individual chips are called Panels. The software allows to choose from the available panels through a fropdown option provided.
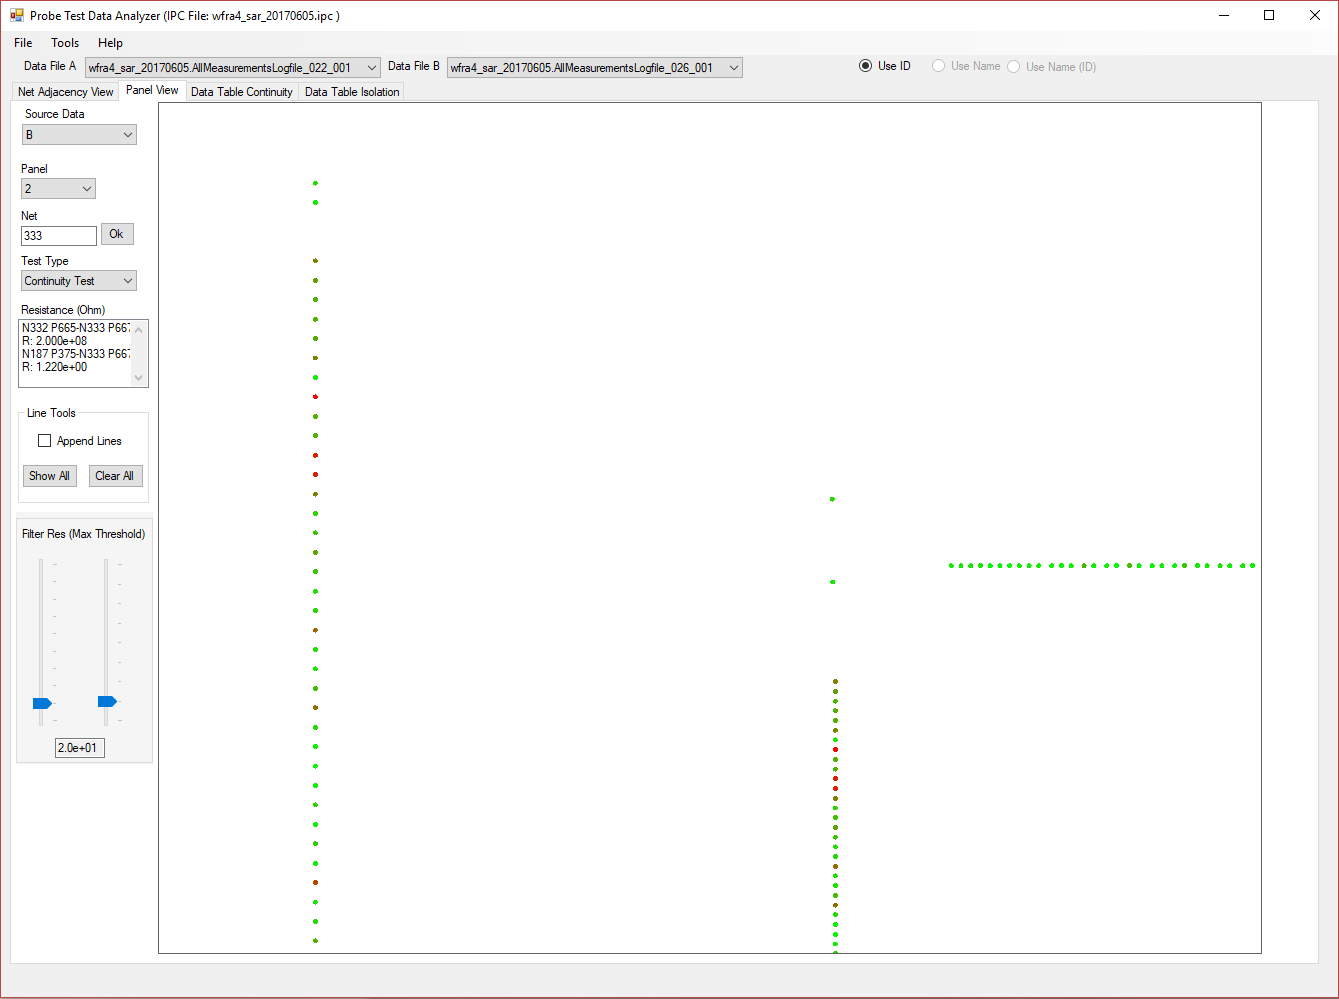
The resistance for each measurement is shown in color scale (color gradient) from light green to dark red. Dark red represents resistance above threshold value in continutiy test (or below threshold in isolation test). Therefore, the more red the point gets, the closer the resistance is to the threshold. The threshold can be changed via the sliders provided. By clicking on each Pad, the resistance measurement between the selected pad and any other pad that the measurement is performed is shown in the list box. Line tools can be used to view which pads are measured against each other for a test by drawing a line between them.
Data Tables
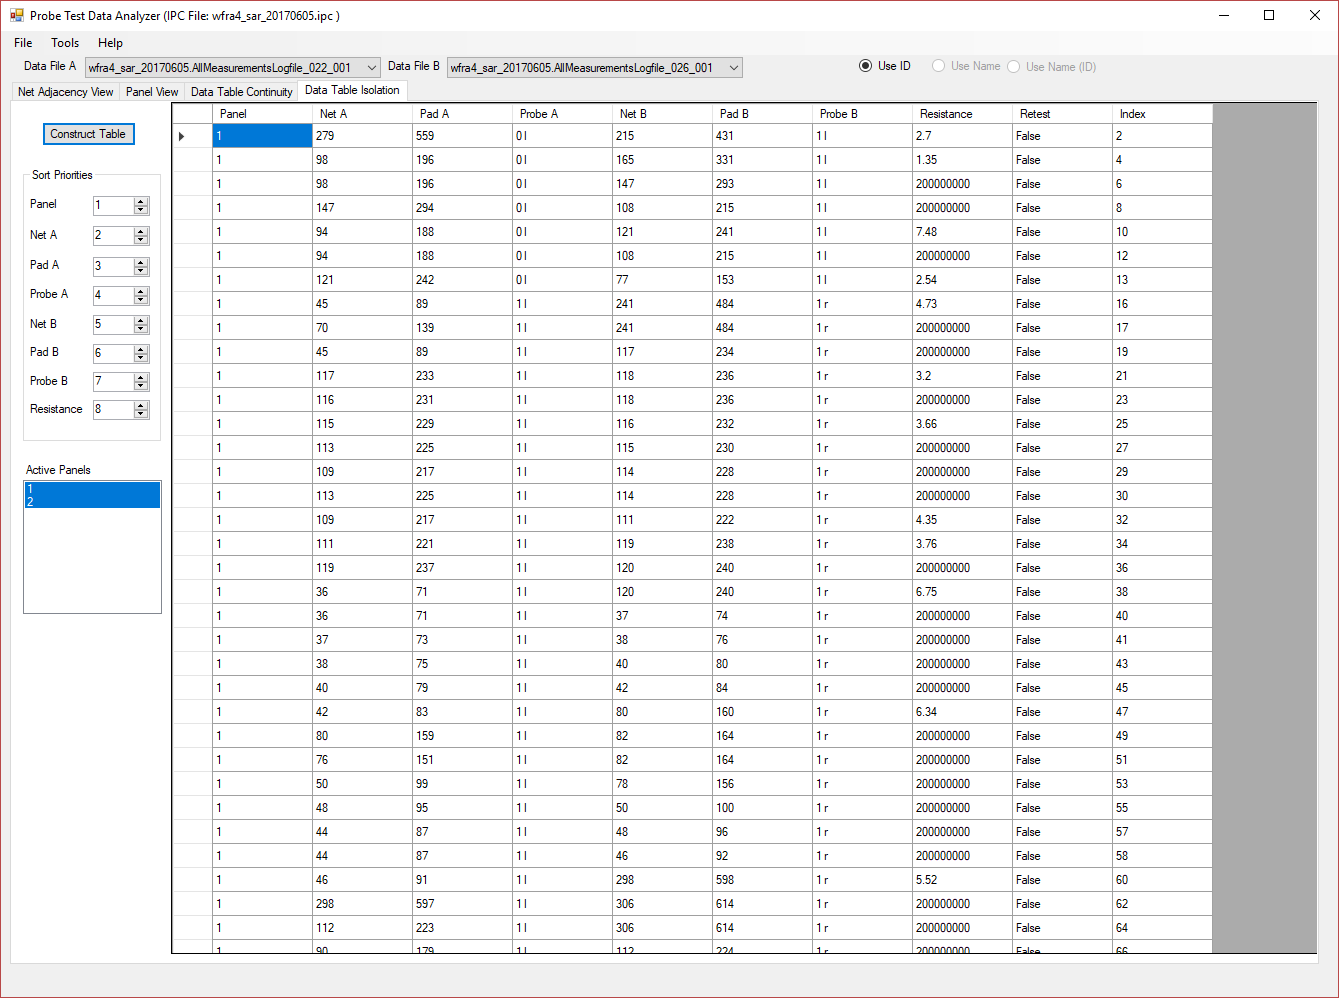
To inspect all the values and extract more information, every piece of data in the measurement data file is accessible through tables for continuity and isolation tests. The user can select panels s/he wishes to view and by clicking on the construct table button, the table will be populated. The tables can be sorted by clicking on the desired column. Further, sorting priorities (e.g. second, third, ... priorities) can be set using the provided priority selection boxes. Through this a user can assign priorities for other columns.
Graphs
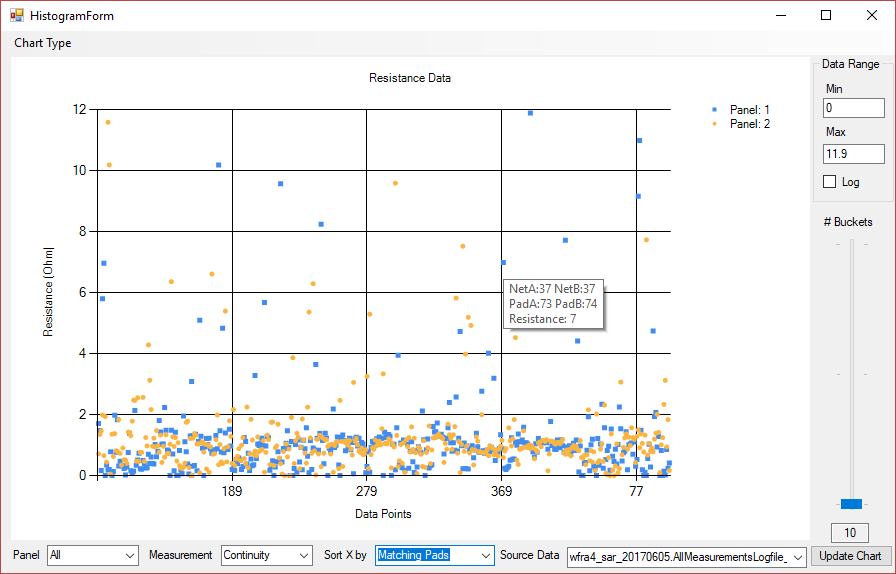
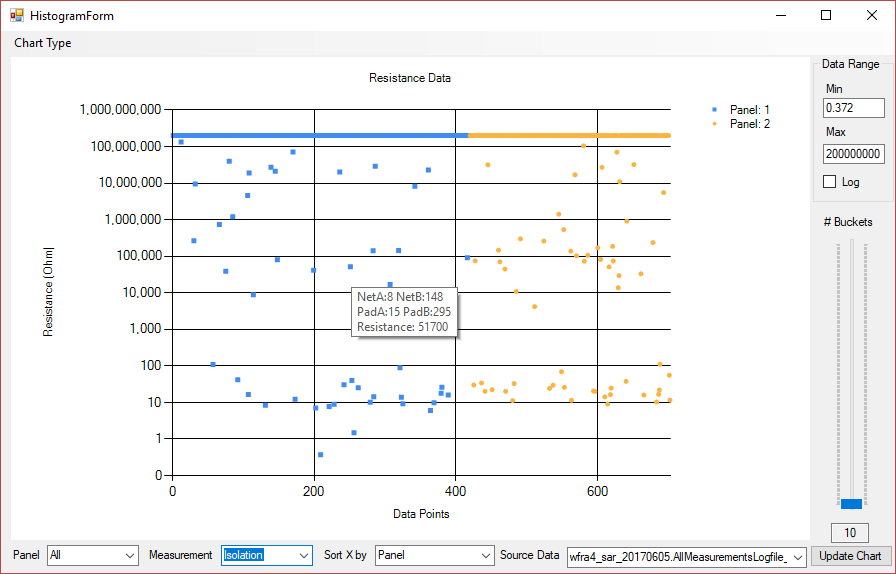
Graphs allow the user to have a quick look over the entire range of data, by looking at all panels at the same time, or individually. Graphs provide two types:
- Data point vs Resistance
- Histogram (Resistance range vs Frequency)
Data point vs Resistance, allows the user to look at the level of resistances, and identify the measurements that might be problematic. By hovering the mouse on each measurement, the information regarding the Pad#, Net#, and resistance is displayed as a tooltip. The graphs are zoomable and pannable, allowing for closer look at individual data points.
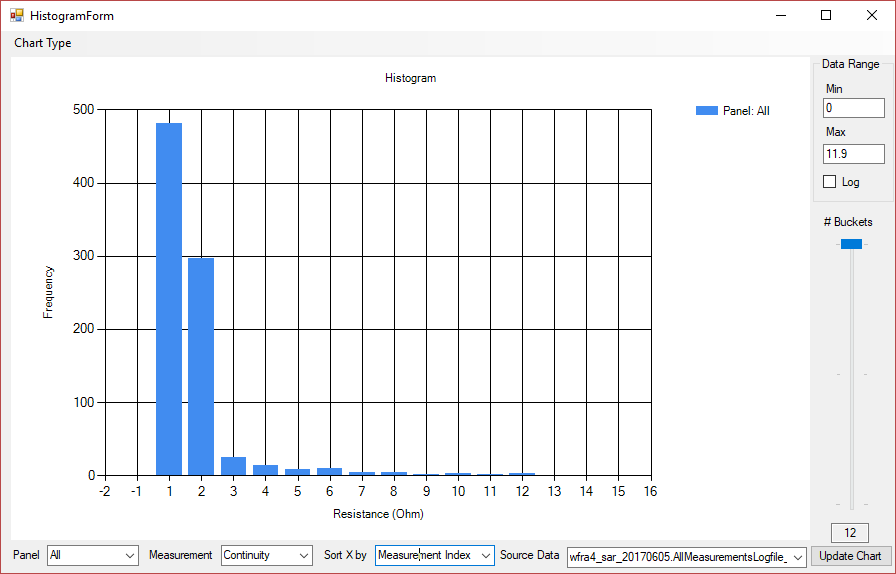
Histogram is used to view distribution of data points. Resistance ranges (buckets) can be set using the slider on the right hand side of the graph. This allows for fine to coarse control of the buckets.
